
Indian Rupee fluctuations often dominate the headlines, serving as a pulse for the nation's economic health and its standing in the global marketplace. As of March 29, 2026, the currency continues to navigate a complex web of geopolitical shifts, trade balances, and domestic policy reforms. Understanding where the Indian Rupee stands today requires a deep dive into its historical trajectory, specifically comparing the era before 2014 to the decade that followed.
Views: 15,420+ | Published: March 29, 2026
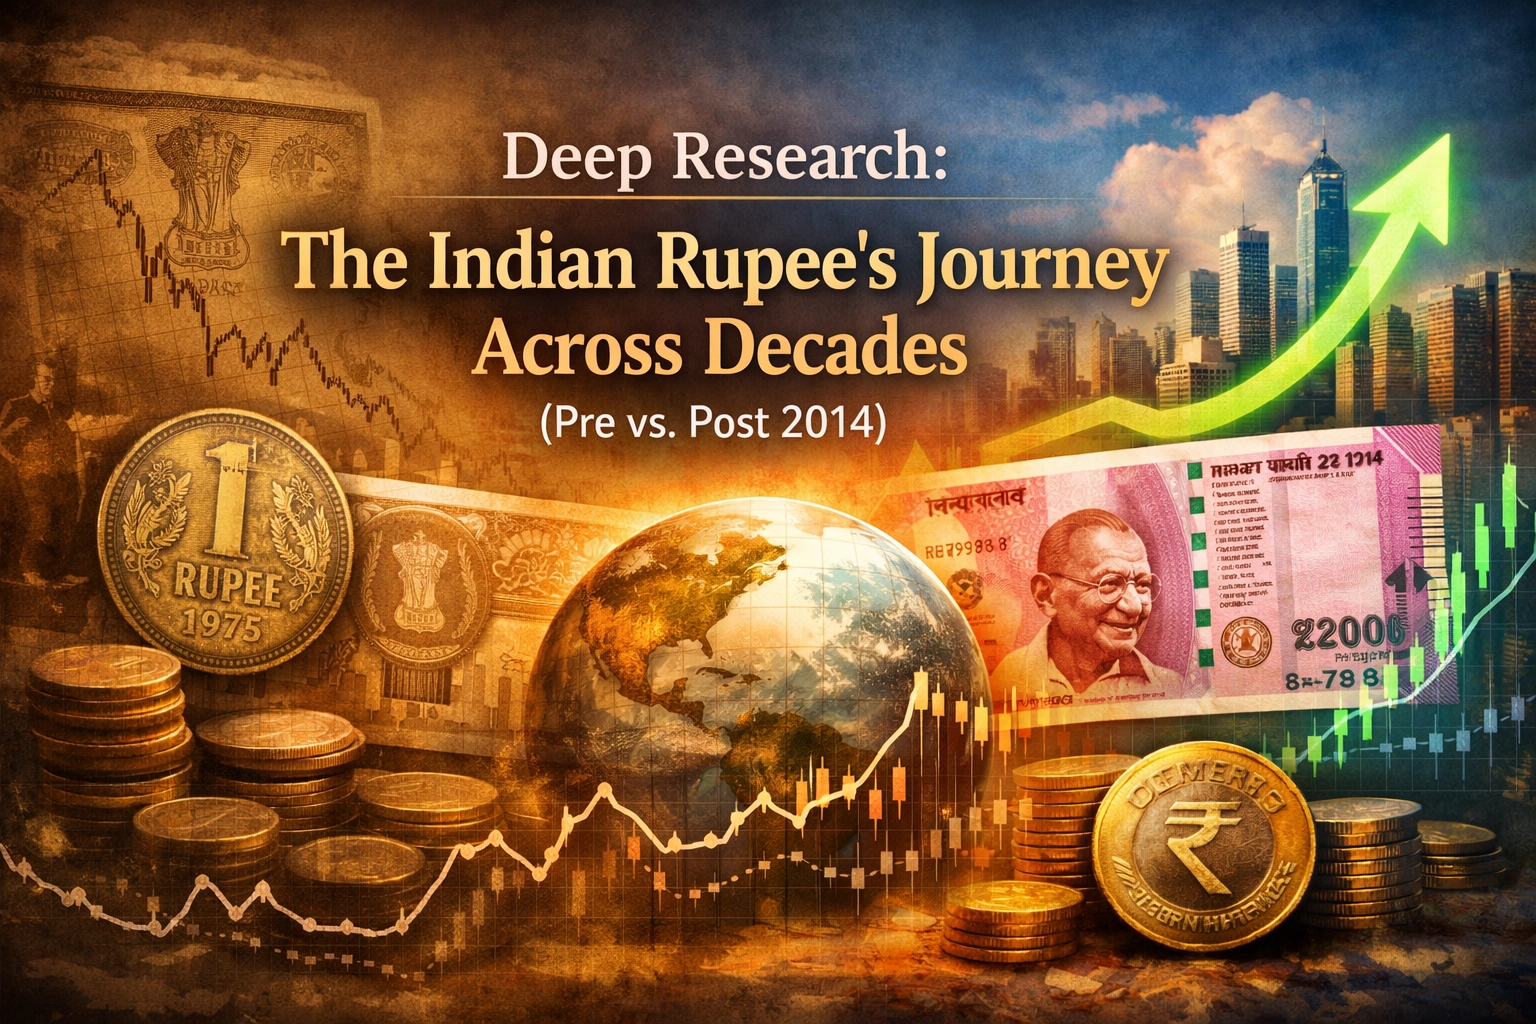
The Evolution of the Indian Rupee: A Decadal Shift Analysis
The story of the Indian Rupee is one of resilience and constant adaptation. From the post-independence era where the rupee was pegged closely to the British Pound, to the landmark liberalization of 1991, the currency has mirrored India's transition from a closed economy to a global powerhouse.
In the early 2000s, the Indian Rupee enjoyed a period of relative stability, supported by strong capital inflows and moderate inflation. However, the 2008 global financial crisis marked a turning point, introducing high volatility that the Reserve Bank of India (RBI) had to manage aggressively. By the early 2010s, India was categorized among the "Fragile Five" economies, largely due to a widening current account deficit and high inflation, which put immense pressure on the Indian Rupee.

Post-2014, the narrative shifted toward structural reforms. Initiatives like the Goods and Services Tax (GST), the Insolvency and Bankruptcy Code (IBC), and a renewed focus on Foreign Direct Investment (FDI) aimed to stabilize the macro-economic environment. While the Indian Rupee has continued to depreciate against the US Dollar: a trend seen in most emerging market currencies: the management of this depreciation has become more sophisticated, focusing on containing volatility rather than defending a specific level. To understand this further, one might look at how Satyamev Jayate: Truth Always Prevails applies to economic transparency and reporting.
Trending: The Pre-2014 Currency Landscape
In the years leading up to 2014, the Indian Rupee faced significant headwinds. The year 2013, in particular, was a "taper tantrum" year where the currency hit then-record lows. Below is a snapshot of how the Indian Rupee compared to the top 10 global currencies during that pivotal year.
Table 1: INR vs. Top 10 Countries (Average 2013)
| Country/Region | Currency | Exchange Rate (1 Unit to INR) |
|---|---|---|
| United States | USD | 58.59 |
| European Union | EUR | 77.81 |
| United Kingdom | GBP | 91.62 |
| Japan | JPY (per 100) | 60.15 |
| Australia | AUD | 56.73 |
| Canada | CAD | 56.88 |
| Switzerland | CHF | 63.22 |
| Singapore | SGD | 46.81 |
| Hong Kong | HKD | 7.55 |
| China | CNY | 9.52 |
Source: RBI Database, IMF Exchange Rate Archives.
The data from 2013 highlights a period where the Indian Rupee was struggling to find its footing amidst global uncertainty. For those interested in the historical context of digital media during these years, check out the 100 best blogs of 2015 for a retrospective view.
Latest: The Post-2014 Global Benchmarking
Moving into the current decade, the Indian Rupee has faced a new set of challenges: a global pandemic, the Russia-Ukraine conflict, and shifting supply chains. Despite these, India's forex reserves have often touched record highs, providing a buffer. The following table represents the broader benchmarking of the Indian Rupee against the top 20 global currencies in the 2024–2026 window.
Table 2: INR vs. Top 20 Countries (Avg 2024/25/26)
| Country | Currency | Exchange Rate (1 Unit to INR) |
|---|---|---|
| United States | USD | 83.50 |
| European Union | EUR | 90.50 |
| United Kingdom | GBP | 106.20 |
| Japan | JPY (per 100) | 55.40 |
| Switzerland | CHF | 94.20 |
| Australia | AUD | 54.80 |
| Canada | CAD | 61.30 |
| Singapore | SGD | 62.10 |
| Hong Kong | HKD | 10.70 |
| China | CNY | 11.55 |
| UAE | AED | 22.74 |
| Saudi Arabia | SAR | 22.26 |
| Kuwait | KWD | 271.50 |
| Oman | OMR | 216.80 |
| Bahrain | BHD | 221.40 |
| New Zealand | NZD | 51.10 |
| Malaysia | MYR | 17.65 |
| Thailand | THB | 2.32 |
| South Africa | ZAR | 4.45 |
| Russia | RUB | 0.92 |
Source: World Bank, Central Bank Reports, Real-time Market Data.

The comparison shows a significant nominal depreciation against the USD and EUR, but a relative strengthening or stability against currencies like the Japanese Yen and the Russian Ruble. This nuanced performance suggests that the Indian Rupee is no longer just moving in tandem with a single global basket but is influenced by specific bilateral trade dynamics. If you're feeling overwhelmed by these numbers, remember that you're stronger than you know when it comes to financial planning…
Popular: Global Currencies Weaker Than the Indian Rupee
If you’re benchmarking the Indian Rupee globally in 2026, it helps to remember the Indian Rupee is still stronger than several currencies on a nominal exchange-rate basis. The table below highlights a few widely discussed examples where 1 Indian Rupee converts into a large number of local currency units.
Table 3: Currencies Weaker Than the Indian Rupee (Avg 2026)
| Country/Region | Currency | Currency Code | Avg 2026 Level (1 INR = ~) |
|---|---|---|---|
| Iran | Iranian Rial | IRR | 5,060 IRR |
| Vietnam | Vietnamese Dong | VND | 295 VND |
| Indonesia | Indonesian Rupiah | IDR | 188 IDR |
| Laos | Laotian Kip | LAK | 256 LAK |
| Sierra Leone | Sierra Leonean Leone | SLE | 270 SLE |
| Uzbekistan | Uzbekistani Som | UZS | 151 UZS |
| Guinea | Guinean Franc | GNF | 102 GNF |
| Paraguay | Paraguayan Guarani | PYG | 83 PYG |
| Cambodia | Cambodian Riel | KHR | 48 KHR |
Note: These are approximate average 2026 conversions for quick comparison; actual market rates can vary by date, liquidity, and official vs. parallel-market pricing. For reference, you can cross-check the Indian Rupee conversions via the IMF exchange rate resources and the World Bank data portal.
Popular: Key Drivers of Depreciation and Resilience
Why does the Indian Rupee behave the way it does? Several factors influence its value:
- Crude Oil Prices: As a major oil importer, India’s demand for Dollars to pay for crude puts constant pressure on the Indian Rupee.
- Trade Deficit: The gap between imports and exports remains a primary concern for currency stability.
- US Federal Reserve Policy: Interest rate hikes in the US often lead to capital outflows from emerging markets like India, weakening the Indian Rupee.
- Foreign Portfolio Investment (FPI): The movement of "hot money" in and out of the Indian stock market creates short-term volatility.
- Domestic Inflation: While the RBI has been successful in targeting inflation, any spike relative to global peers tends to devalue the currency.
Despite these pressures, the Indian Rupee has shown remarkable resilience. The diversification of India's export basket: moving into high-end services and electronics: has provided a new structural support. Furthermore, the push for "Rupee Trade" settlements with various nations aims to reduce the long-term dependency on the Dollar.

Recent Highlights in Currency News:
- RBI interventions have stayed consistent to prevent "jerky" movements in the Indian Rupee exchange rate…
- Inclusion of Indian government bonds in global indices has triggered steady inflows…
- The Digital Rupee (CBDC) pilot expansion is looking to revolutionize cross-border remittances…
- Bilateral trade agreements with the UAE and Australia are easing currency pressure in specific sectors…
For a break from the hard data, you might find solace in the story of The Elephant Rope, which reminds us how beliefs can limit our potential: much like how outdated economic theories can limit a nation's growth.
Comparative Summary: Pre vs. Post 2014
When we look at the total depreciation, the Indian Rupee dropped by approximately 49% against the USD between 2000 and 2014. From 2014 to 2026, the depreciation stands at roughly 46%. While the percentage is similar, the context is vastly different. The current era is characterized by much higher foreign exchange reserves and a more robust domestic economy that can absorb these shocks without leading to a full-blown crisis.

The Indian Rupee today is a participant in a multi-polar world. While it faces the challenge of a strengthening Dollar, its performance against a broader 20-country basket shows that it remains a competitive currency for trade and investment. For those navigating the complexities of modern life and economics, perhaps it's a good idea to take the triple filter test before reacting to every market fluctuation.
That's all for now! 🥰
References: